Today, we are going to work with a dataset that documents cases where NYC Urban Park Rangers respond to requests for animal assistance, relocation, and/or rescue. If you are unfamiliar with what an Urban Park Ranger does, you may want to check out this video!
Note the information listed in the “About this Dataset” section. This is administrative metadata.
Note the attachment in this section with the file name: UrbanParkRangerAnimalConditionResponse_DataDictionary_20181107.xlsx. This contains descriptive metadata for this dataset.
Scroll to the ‘Table Preview’ at the bottom of the page. This previews this data as a rectangular dataset.
Answer the following questions by discussing in your groups:
What is the unit of observation in this dataset? In other words, what does each row signify? How do you know?
How frequently is this dataset updated? How do you know?
What are the possible values for the Species Status variable in this dataset? How do you know?
What is the value at index [4,4] in this dataset? How do you know?
Identify the index of one missing value in this dataset.
Identify one nominal variable, one ordinal variable, one discrete variable, and one continuous variable.
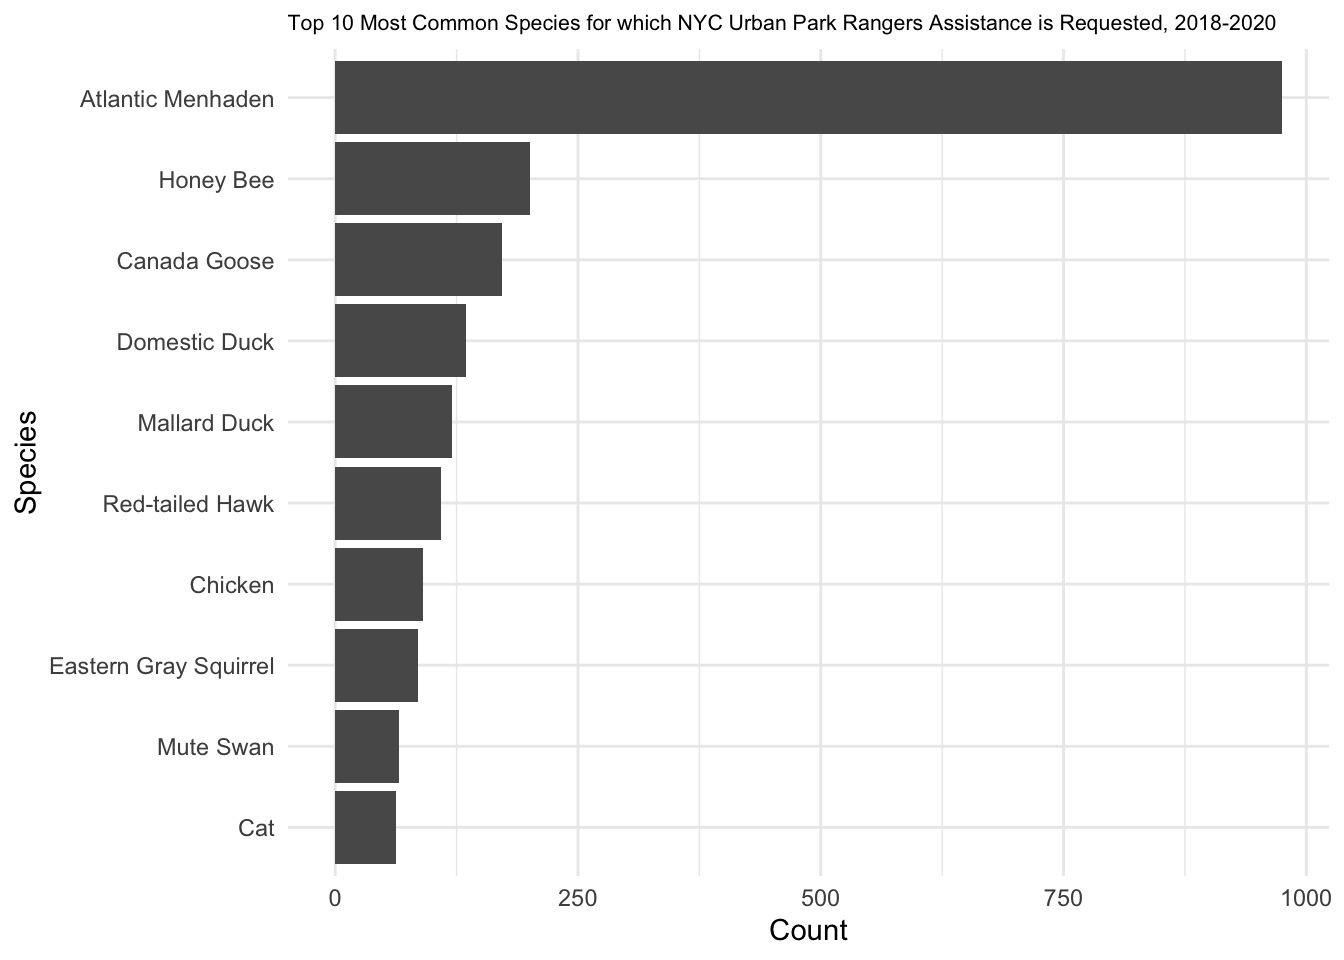
As a preview of what you will be able to do in a few weeks, here is a visualization of the most commons species for which services are requested in NYC!
library(tidyverse)nyc_urban_ranger <-read_csv("https://data.cityofnewyork.us/api/views/fuhs-xmg2/rows.csv",name_repair = make.names)nyc_urban_ranger %>%group_by(Species.Description) %>%summarize(Count =sum(X..of.Animals)) %>%top_n(10, Count) %>%ggplot(aes(x =reorder(Species.Description, Count), y = Count)) +geom_col() +coord_flip() +labs(title="Top 10 Most Common Species for which NYC Urban Park Rangers Assistance is Requested, 2018-2020", x ="Species", y ="Count") +theme_minimal() +theme(plot.title =element_text(size=8))