library(httr)
library(tidyverse)
library(leaflet)
library(sf)Lab 10: APIs
Introduction
In this lab, we will write queries to access subsets of a very large dataset on the NYC Open Data Portal. We will practice all of the standards we have learned in the course so far in visualizing and wrangling the resulting data.
Learning Goals
- Write API Queries
- Recognize different HTTP Response Codes
Review of Key Terms
Tip
You may wish to reference this reference guide when completing this lab.
- Application Programming Interface (API)
-
an mechanism that allows programmers or other systems (or users) to access resources from or post data to an online data service
- HTTP
-
a Web protocol for transmitting documents (e.g. Web pages, images, datasets, etc.) between web servers and browsers
- Endpoint
-
An exposed portion of an online data service that clients can assess via API queries
NYC 311 Service Requests
311 is a dialing code set aside in many cities across the US to field calls about requests for municipal service – fixing potholes, reporting noise complaints, reporting parking infractions, etc. NYC has one of the most comprehensive 311 programs in the country, fielding calls to be routed to one of the city’s 77 agencies. Unlike in many other cities, New Yorkers can call 311 to report sexual harassment in taxi cabs or to report tenant rights issues (like a landlord failing to address a lack of heat or hot water). In October 2011, data documenting each request for service New Yorkers had made to 311 began to be published daily to the city’s public-facing open data portal. Since then, the dataset has become one of the largest and most complex archived and maintained on the portal, which includes datasets covering topics from restaurant health inspections, to crime statistics, to construction permits. Each row in the 311 dataset details one anonymized and geocoded request - the type of request that was made, when it was made, the location where the incident occurred, and how the relevant NYC agency responded. As of November 2022, the dataset has over 31 million rows, representing service requests made to 311 since 2010.
When the 311 program was introduced, it was celebrated for its bottom-up approach to producing empirical evidence about problems facing New Yorkers; the program buttressed a persuasive techno-liberal imaginary, suggesting that fair and unbiased representation of quality of life concerns would emanate through the crowd-sourced data. When wrangled and visualized, the data can produce persuasive narratives about the state of equity and quality of life in communities across NYC, and thus a number of communities now leverage the data to legitimate claims. Community boards regularly cite 311 statistics about noise, infrastructure, and rodent issues when preparing district budget requests. Activists present the data to city legislators when advocating for or against new housing and transportation laws. Cyclists have produced apps that track complaints about the blocked bicycle lanes in New York. Journalists regularly reference the dataset to report which communities have received the most noise complaints, have had the most restaurants not following Covid-19 orders, or have had the most rat sightings. In 2018, eight pieces of legislation introduced by City Council required data about various issues – from rodent complaints, to noise complaints, to complaints about sexual harassment in taxis – be reported to the city agencies responsible for addressing those issues.
Yet, while representatives acknowledge 311 data to be a useful form of evidence for quality of life issues, they can be hesitant to rely on 311 statistics alone to measure urban problems. Communities that regularly leverage 311 open data warn that the data does not “represent” the saturation of problems in the city but that they represent “where people are complaining in the city.”
Mapping the data shows that, for almost all reported issues, 311 complaints are disproportionately high in gentrifying communities. The data under-represents problems in areas where individuals do not know to report, do not have the capacity to report, or fear harassment (from their landlords or bosses) for reporting. Complaints about NYC Housing Authority (NYCHA) are entirely excluded from the data. The data also over-represents problems when weaponized against minority communities and small businesses to consistently report minor and sometimes false noise issues or legal infractions. While this highlights how the dataset is being used to propagate inequity across the city, activists have also recognized that they can leverage 311 in liberatory ways. I’ve interviewed tenant rights groups that will run 311 calling campaigns in housing complexes, which can significantly increase the number of complaints made at a particular address - not necessarily because it is experiencing more issues than the building next to it, but because there has been advocacy around reporting the issues at this location.
Setting Up Your Environment
Install the
httrpackage.Run the code below to load the packages for today’s lab
How do APIs work?
APIs enable us to access data from an online service via an API query. Here are the steps that take place behind the scenes when we issue a Web-based API query:
We provide a line of code that indicates the location of a database online (or the data’s endpoint) and what subsets and aggregates of data want. This line of code is called an API query. API queries look very much like URLs that you enter into a Web browser to access a Web page.
We issue that request by entering the API query into a Web browser, or by referencing it via an import function in
R.A request to GET the data resource is issued via the Hypertext Transfer Protocol (HTTP) - a protocol that manages the transfer of data between clients and servers on the Web. HTTP sends a request to the location indicated by the endpoint to retrieve the data.
A response code gets issued from the server to the client. There are many codes associated with different issues, but here are the most common:
200indicates success (or that the data can be accessed).
example <- GET("http://smith.edu/")
example[["status_code"]]
[1] 200403indicates that the client does not have permission to access the data.404indicates that the resource could not be found at the endpoint the client specified. For example, below the directorythis-url-does-not-existdoes not exist at http://smith.edu/.
example <- GET("http://smith.edu/this-url-does-not-exist")
example[["status_code"]]
[1] 404If successful, the server also sends the requested resource to the client.
This all happens very quickly, and most of it we don’t see!
Writing API Queries
An API query can be parsed into component parts:
- An endpoint to the data resource
- The format we want the data returned in (e.g. CSV, JSON, XML)
- Parameters indicating what subsets/aggregates of the data that we want
- A reference to an API key that grants us access to the data
Different APIs have different syntax rules for formatting API queries, so it is important to reference the API documentation to learn how these component parts come together.
Today we are going to use the API that is made available from Socarata. Socrata is a Web hosting platform that is very commonly used by state and municipal governments, along with federal agencies, to host open government datasets. For example, the City of New York, the City of Chicago, the US Center for Disease Control, and the state of Texas all use the Socrata platform to host datasets they wish to make available to the public. Because Socrata is managing the data, Socrata also defines the API to access the data. A Socrata API query will follow this basic format:
<endpoint>.<format>?<optional-parameters>
Note that most calls to Socrata do not require an API key.
Tip
NYC 311 is updated very often, and APIs allow us to access the most recent data available at a service. This means that your results for this lab will probably look different from mine. My results are based on running these codes on the evening of November 29, 2022.
Question
Write an API query to access data at the endpoint https://data.cityofnewyork.us/resource/erm2-nwe9 in a CSV format. Let’s not worry about adding parameters yet. The resulting data frame should look something like my data frame below.
# Code below!

#nyc_311 <- read_csv(<URL HERE!>)
#head(nyc_311)
$limit
Note that this will only return the first 1000 rows of data.
…but we know from examining the “311 Service Requests from 2010 to Present” metadata that this dataset has over 30 million rows. By default, the API limits the amount of data that gets sent to us so as not to overwhelm our systems.
We can manually adjust how much data gets sent by setting the limit parameter to a specific number of rows we wish to have returned. To add a parameter to a Socrata query, first, we put a ? at the end of the query. This indicates that we’re about to list a series of parameters. We then reference parameter names we wish to set behind a $ (e.g. ...?$limit). Finally, we set values to those parameters by adding =<some-value> after the parameter name. (e.g. ...?$limit=10).
Question
Let’s say I wanted to access data at the endpoint https://data.cityofnewyork.us/resource/erm2-nwe9 in a CSV format. Let’s not worry about adding parameters yet. Adjust your call above to limit the results to 20 rows of 311 data. The resulting data frame should look something like my data frame below.
# Code below!

#nyc_311 <- read_csv(<URL HERE!>)
#head(nyc_311)
Additional parameters are available to subset and aggregate our data in various ways. Socrata has it’s own query language called SoQL, which codifies these parameters. SoQL is modeled after SQL - a language for querying data stored in large relational databases. Many SoQL parameters have a direct translation to SQL parameters. …and many of the parameters also have a direct translation to our dplyr data wrangling verbs.
dplyr |
SoQL |
SQL |
|---|---|---|
head() |
$limit |
LIMIT |
select() |
$select |
SELECT |
filter() |
$where |
WHERE |
group_by() |
$group |
GROUP BY |
arrange() |
$order |
ORDER BY |
$select
This dataset has 41 columns, and many of the variables in this dataset will not be immediately relevant to a data science task at hand. By pulling all of the columns, we are requesting much more data (and space on our computers!) than we actually need. We can request that only specific columns be returned via the $select= parameter. We assign the names of the fields we wish to have returned to this parameter. We can find the names of the fields at our data documentation here.
Tip
Note that we use %>% or |> to string together multiple data wrangling verbs in dplyr. When writing SoQL, we use & to string together multiple parameters (e.g. ...?$limit=<value>&$select=<value>.
Question
Create an API call to return the unique keys and complaint types for the latest 30 entries in NYC’s 311 open dataset. In other words, translate the following dplyr call into a SoSQL query:
nyc_311 %>%
  select(unique_key, complaint_type) %>%
  head(30)
Plot the counts of complaint types as a barplot. It should look something like my plot below.
# Code below!
# nyc_311_unique_keys <- read_csv(<URL HERE!>)
# Plot here!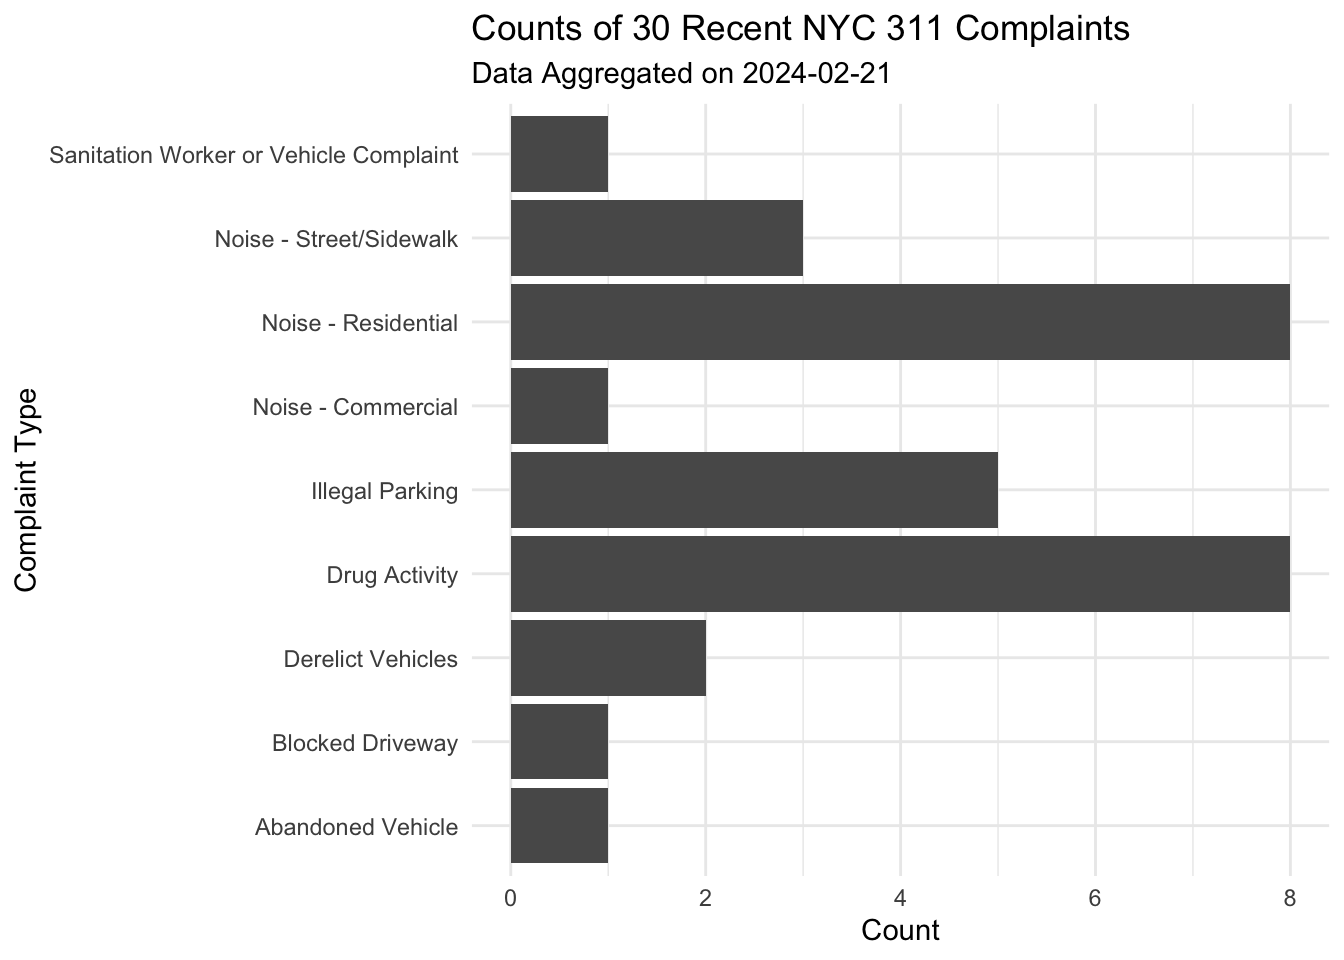
$where
It’s most likely that I don’t want just 30 random rows of data, but instead that I want specific subsets of the data. We can use the $where= parameter to filter the data to relevant rows. Just like with filter() in dplyr, we can return cases where the values in a row are equal to (=), not equal to (!=), greater than (>), or less than (<) a value we supply (e.g. $where=<field>=<value> or $where=<field>><value>)
Percent Encoding
When determining the value that we are going to supply to the $where parameter, it’s important to keep in mind that not all characters are safe to include in URLs. Some of our keyboard characters serve special purposes in URLs. For instance, the / is used to indicate a sub-directory, and (as we’ve just learned) ? are used to indicate that we are about to string a series of parameters to the end of the URL. Because these characters serve special purposes in a URL, we can’t use them when writing out our value in the ?where parameter… So what do we do when we want to supply a value that includes one of these special characters?
This is where percent encoding comes in. Whenever we would normally use the special characters listed below on the left in a URL, we would replace it with the percent encoding listed on the right.
- space
:%20 !:%21":%22%:%25':%27-:%2D
So for instance, the following: 'Noise - Commercial' includes five reserved characters:
- an apostrophe
- a space
- a dash
- another space
- another apostrophe.
I would encode that value as follows: %27Noise%20%2D%20Commercial%27.
Create an API call to return the unique keys, created_dates and complaint_types for the rows where the agency is listed as ‘FDNY’. In other words, translate the following dplyr call into a SoSQL query:
nyc_311 %>%
  select(unique_key, created_date, complaint_type) %>%
  filter(agency == 'FDNY')
Plot the data as a point point to match my plot below.
# Code below!
# nyc_311_fdny <- read_csv(<URL HERE!>)
# Plot here!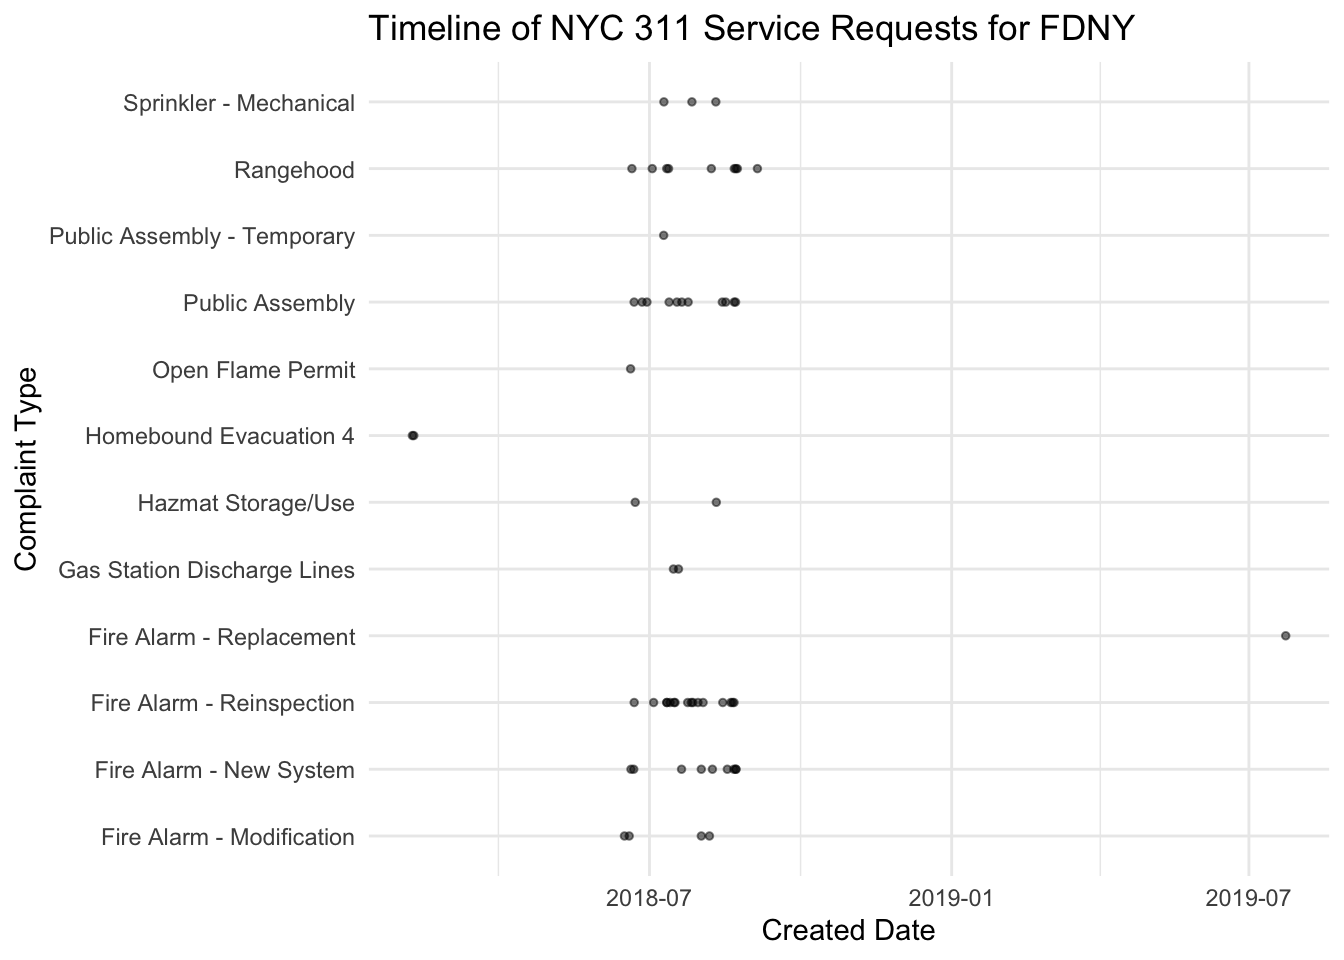
We can also string together multiple filter conditions with operators like AND, OR, NOT, IS NULL, etc. $where=<field>=<value> AND <field>=<value>. Note that there are spaces between the first and second condition above, and spaces are reserved characters. We need to replace those spaces with the percent encodings for spaces: $where=<field>=<value>%20AND%20<field>=<value>.
Question
Create an API call to return the unique keys, created dates, incident addresses, and BBLs (this is a unique ID for the tax lot of a building in NYC) for rows with complaint type “Food Poisoning” in Manhattan’s community district 5 (which hosts Times Square and other major NYC tourist attractions). Limit the results to 3000 entries in NYC’s 311 open dataset. In other words, translate the following dplyr call into a SoSQL query:
    nyc_311 %>%
      select(unique_key, created_date, incident_address, bbl) %>%
      filter(complaint_type == "Food Poisoning" &
              community_board == "05 MANHATTAN") %>%
      head(3000)
Wrangle the resulting data frame to determine the 5 addresses with the most food poisoning complaints in this community district. It will look something like my data frame below.
# Code below!
# nyc_311_food_poisoning <- read_csv(<URL HERE!>)
$order
The $order parameter will re-arrange the rows, according to the values in a column that we supply, such that the smallest value will appear at the top and the largest value will appear at the bottom (e.g. $order=<field>). We can tack DESC to end of this parameter in order to reverse the sorting order (e.g. $order=<field>%20DESC).
Question
Order the previous result in descending order by created date, and the subset to the 500 most recent complaints. In other words, translate the following dplyr call into a SoSQL query:
    nyc_311 %>%
      select(unique_key, created_date, incident_address, bbl) %>%
      filter(complaint_type == "Food Poisoning" &
              community_board == "05 MANHATTAN") %>%
      arrange(desc(created_date)) %>%
      head(500)
Wrangle the resulting data frame to determine the count of complaints at each BBL, and order the results by the count. Store the data frame in nyc_311_food_poisoning_ordered_counts.
I’ve written an API query to return most recent restaurant grades for restaurants in Manhattan’s community district 5. Join the two data frames by the bbl.
Note that there can be more than one restaurant on a particular tax lot. This means that, if there were x number of Food Poisoning complaints at a particular lot, those complaints may have been associated with any number of restaurants at that lot. BBL is the most specific field we have available for identifying the location associated with a complaint in 311. This means that we are most likely going to have a one-to-many join, and we need to be careful when making assumptions about associations across the datasets.
Your resulting data frame should look something like mine below.
# Code below!
# nyc_311_food_poisoning_ordered <- read_csv(<URL HERE!>)
# nyc_311_food_poisoning_ordered_counts <- <WRANGLE HERE!>

restaurant_inspections <- read_csv("https://data.cityofnewyork.us/resource/43nn-pn8j.csv?$where=community_board=%27105%27%20AND%20grade%20IS%20NOT%20NULL&$select=camis,dba,bbl,grade,max(grade_date)&$group=camis,dba,bbl,grade&$limit=3000")

# Join datasets here!
Dates can be tricky to work within APIs because we need to know exactly how they are formatted in order to do meaningful things with them. Typically we want to look up how dates are formatted in the API documentation. In this dataset, the dates are formatted as follows: yyyy-mm-ddThh:mm:ss.0000 (e.g. 2022-11-01T00:00:00.000).
When we know how dates are formatted, there’s often many ways we can subset the data to certain dates. For instance, I can access all of the rows where a date is between('date 1' AND 'date 2'). I can extract the year as an integer from a column using date_extract_y(<date-field>) and then filter to the rows in that year. A full list of data transformations that can be applied is Socrata is available here.
Question
Create an API call to return the unique keys, incident addresses, and created dates for rows with complaint type “Construction Lead Dust” that were created in October 2022. In other words, translate the following dplyr call into a SoSQL query:
    nyc_311 %>%
      select(unique_key, created_date, incident_address)
      filter(complaint_type == 'Construction Lead Dust' &
              created_date > '2022-10-01' &
              created_date < '2022-10-30')
Once you get this working, write a function called get_construction_lead_dust_complaints. This function will take a borough as an argument, and should construct a string URL that will further filter the data to a given borough (hint: you will need the function paste0 to construct this string). In your function, read the data frame using read_csv and return the data frame.
I’ve created a vector of three NYC boroughs for you. Iterate your function over this vector, returning the results as a data frame with rows bound. Your resulting data frame should look something like mine below.
# Code below!
# nyc_311_construction_lead_dust <- read_csv(<URL HERE!>)
# get_construction_lead_dust_complaints <- <FUNCTION HERE!>

boroughs <- c("MANHATTAN", "BROOKLYN", "BRONX")

# Write code to iterate function here!
$group
Aggregating in SoQL calls looks and feels a bit different than it does in dplyr. The $group= parameter indicates that we wish to return a result grouped by a particular field. However, instead of using a verb like summarize to indicate that we want to perform a calculation in each group, we are going to specify what aggregated columns we want returned to us via the $select parameter.
So let’s say I want to return counts of the number of rows assigned to each agency in this dataset. In other words, I want a dataframe with a column listing the agency and a column listing the counts of rows with that agency listed.
First, I would set $select=agency,count(*). Here * refers to everything (i.e. all rows), and count() is a function indicating that we should count all rows. After indicating what columns I want back, then I would set $group=agency.
nyc_311_agency <-
  read_csv("https://data.cityofnewyork.us/resource/erm2-nwe9.csv?$select=agency,count(*)&$group=agency")

head(nyc_311_agency)
Question
Create an API call to return the counts per descriptor and borough for the complaint type “Consumer Complaint.” In other words, translate the following dplyr call into a SoSQL query:
    nyc_311 %>%
      filter(complaint_type == "Consumer Complaint") %>%
      group_by(descriptor,borough) %>%
      summarize(count = n())
Pivot the data so that there are separate columns indicating counts for each borough in the dataset. Your data frame will look something like mine below.
# Code below!
# nyc_311_consumer_complaint <- read_csv(<URL HERE!>)
# Pivot here!
count(*) is function SoQL function. A full list of similar summary functions in SoQL is available here. Another useful SoQL function is distinct, which can be used to return the distinct values in a column. When we use distinct in conjunction with count, we can count the distinct values in a column (e.g. count(distinct%20<field>)).
Question
Create an API call to return the counts of complaints with the descriptor “Gender Pricing” in each borough, along with the count of distinct incident addresses for these complaints in each borough. In other words, translate the following dplyr call into a SoSQL query:
    nyc_311 %>%
      filter(complaint_type == "Gender Pricing") %>%
      group_by(borough) %>%
      summarize(count = n(),
                count_distinct_incident_address = length(unique(incident_address)) )
Pivot and plot the data to match my plot below.
# Code below!
# nyc_311_gender_pricing <- read_csv(<URL HERE!>)
# Plot here!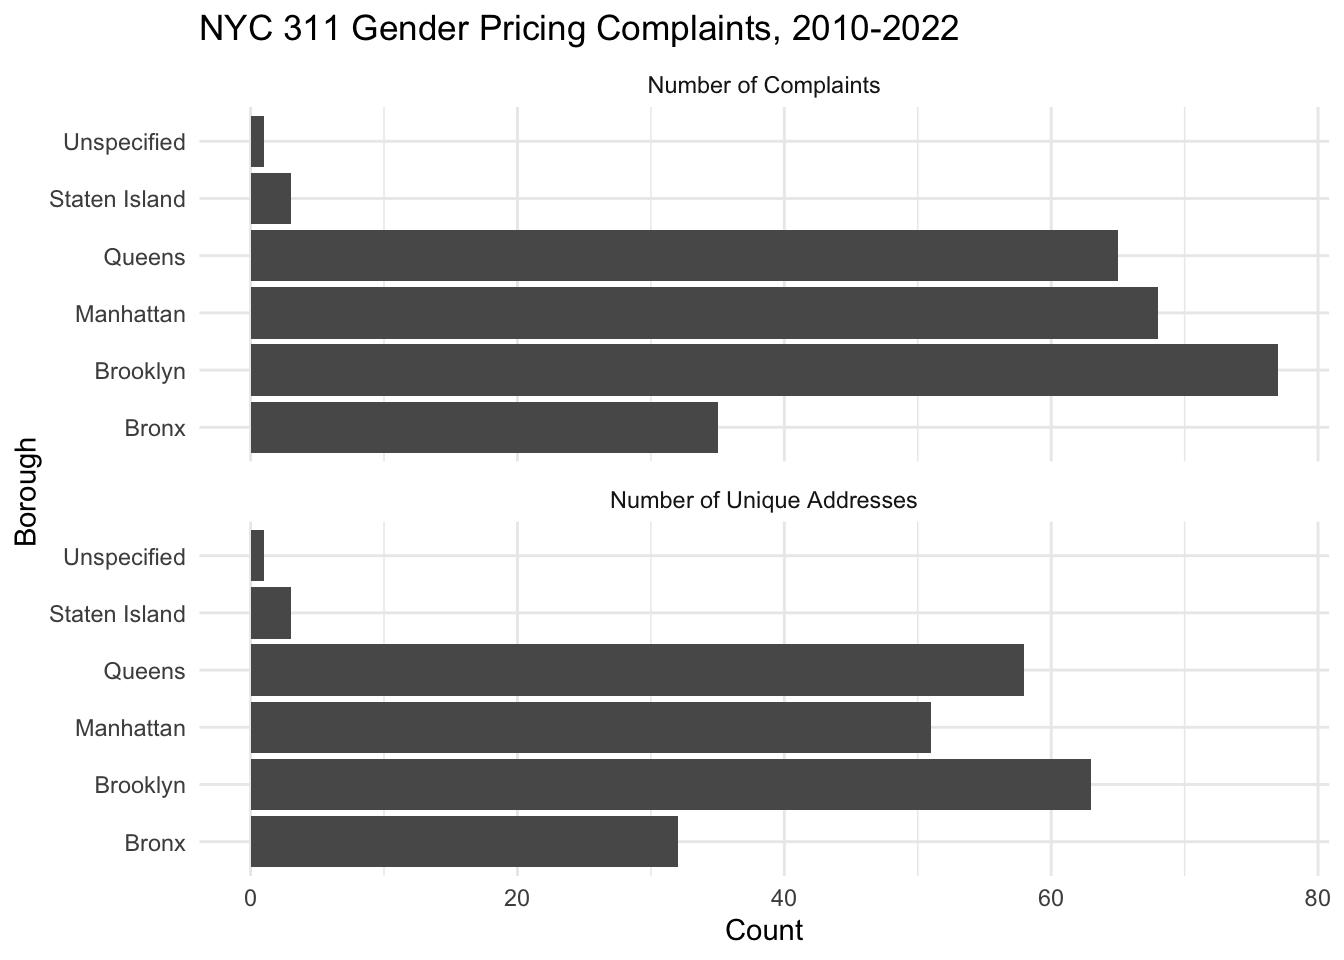
$having
Once we’ve aggregated data in a SoQL query, we no longer use $where= to filter it. Instead, we use $having= to filter aggregate data. For example, in the above call, I could tack on ...&having=count>10 to return the rows from my aggregated data where the count was greater than 10.
Question
Create an API call to return the latitude, longitude, and counts per BBL for the complaint type “HEAT/HOT WATER.” Filter out rows where the BBL is ‘0000000000’, and sort the counts in descending order. Filter the results to the rows where the count of heat and hot water complaints is greater than 1000. In other words, translate the following dplyr call into a SoSQL query:
    nyc_311 %>%
      filter(complaint_type == "HEAT/HOT WATER" &
              bbl != "0000000000") %>%
      group_by(bbl, latitude, longitude) %>%
      summarize(count = n()) %>%
      arrange(desc(count)) %>%
      ungroup() %>%
      filter(count > 1000)
Convert the result into a geom object, create a palette using the counts variable, and map the points via leaflet to match my map below.
# Code below!
# nyc_311_heat_counts <- read_csv(<URL HERE!>) |> st_as_sf()
# Palette here!
# Map here!
Ethical Considerations
As noted in the introductory paragraphs, 311 can both over-count and under-count certain quality of life concerns in New York City. It can be a valuable tool for activists trying to draw attention to certain issues, and it can also be weaponized against certain communities when complaints are issued against an establishment in a discriminatory way. Despite this, the data is often used by city decision-makers to determine where to prioritize resources and services. What is the value of 311 data? When and wow should it be used?