library(tidyverse)

sqf_url <- "https://www1.nyc.gov/assets/nypd/downloads/zip/analysis_and_planning/stop-question-frisk/sqf-2011-csv.zip"
temp <- tempfile()
download.file(sqf_url, temp)
sqf_zip <- unzip(temp, "2011.csv")
sqf_2011 <- read.csv(sqf_zip, stringsAsFactors = FALSE)
sqf_2011_race_cat <- read.csv("https://raw.githubusercontent.com/lindsaypoirier/STS-101/master/Data/SQF/sqf_race_categories.csv", stringsAsFactors = FALSE)
rm(sqf_url)
rm(temp)
rm(sqf_zip)Lab 5: Exploratory Data Analysis
Introduction
In 1968, the Supreme Court case Terry v. Ohio ruled that a police officer could stop an individual without “probable cause” but with “reasonable suspicion” the suspect had committed a crime. Further, an officer could frisk an individual without “probable cause” but with “reasonable suspicion” the suspect was carrying a weapon. In the early 1990s, stop, question, and frisk became a widely prevalent tactic in policing in NYC. However, as the practice expanded in the 2000s, civil rights organizations began calling attention to the ways in which it was fueling the over-policing of NYC neighborhoods, along with racial profiling.
In 2011, David Floyd and David Ourlicht filed a class action lawsuit (on behalf of themselves and other minority civilians in NYC) against the City of New York, Police Commissioner Raymond Kelly, Mayor Michael Bloomberg, and a number of NYPD officers. Their argument was that the NYPD had stopped them without “reasonable suspicion” and that the defendants had sanctioned policies for stopping civilians on the basis of race or national origin. Honorable Shira A. Scheindlin, who oversaw the US District Court Case, ultimately ruled that stop and frisk was being carried out in an unconstitutional way. The officer-reported data that we will examine in this lab was leveraged as key evidence throughout this case.
In this lab, you will apply the 6 data wrangling verbs we learned this week in order to analyze data regarding NYPD stop, question, and frisk. Specifically, we will replicate data analysis performed by the NYCLU in 2011 to demonstrate how the practice was being carried out unconstitutionally in New York. We are specifically going to look at three issues:
- How many times did the NYPD stop an individual in 2011?
- In how many 2011 stops was the stopped individual found to be guilty of a crime?
- In how many 2011 stops that involved a frisk was the individual found to be carrying a weapon?
We are also going to examine the racial breakdown for each of these three questions to assess the extent to which stop and frisk was being carried out in a discriminatory way in 2011.
Learning Goals
Apply data wrangling verbs to subset and aggregate data
Consider the implications of racial categorization
Review of Key Terms
Tip
You may wish to reference this Data Wrangling Cheatsheet when completing this lab.
- filter
-
filters to rows (observations) that meet a certain criteria
- select
-
keeps only selected variables (columns)
- arrange
-
sorts values in a variable (column)
- summarize
-
calculates a single value by performing an operation across a variable (column); summarizing by
n()calculates the number of observations in the column - group_by
-
groups rows (observations) by shared values in a variable (column); when paired with
summarize(), performs an operation in each group - mutate
-
creates a new variable (column) and assigns values according to criteria we provide
Stop, Question, and Frisk Dataset
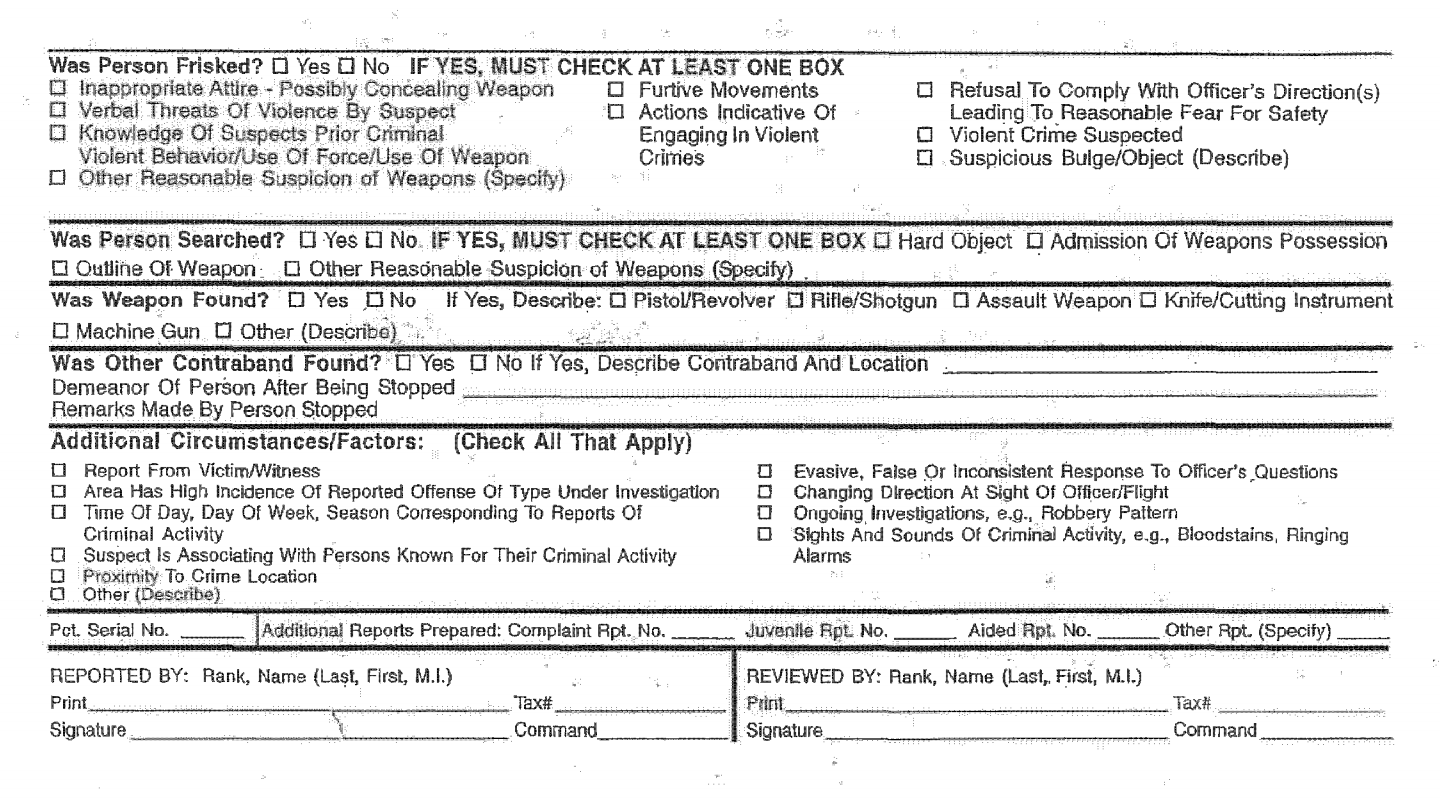
Every time an officer stops a civilian in NYC, the officer is supposed to complete a UF-250 form (see image below) outlining the details of the stop.
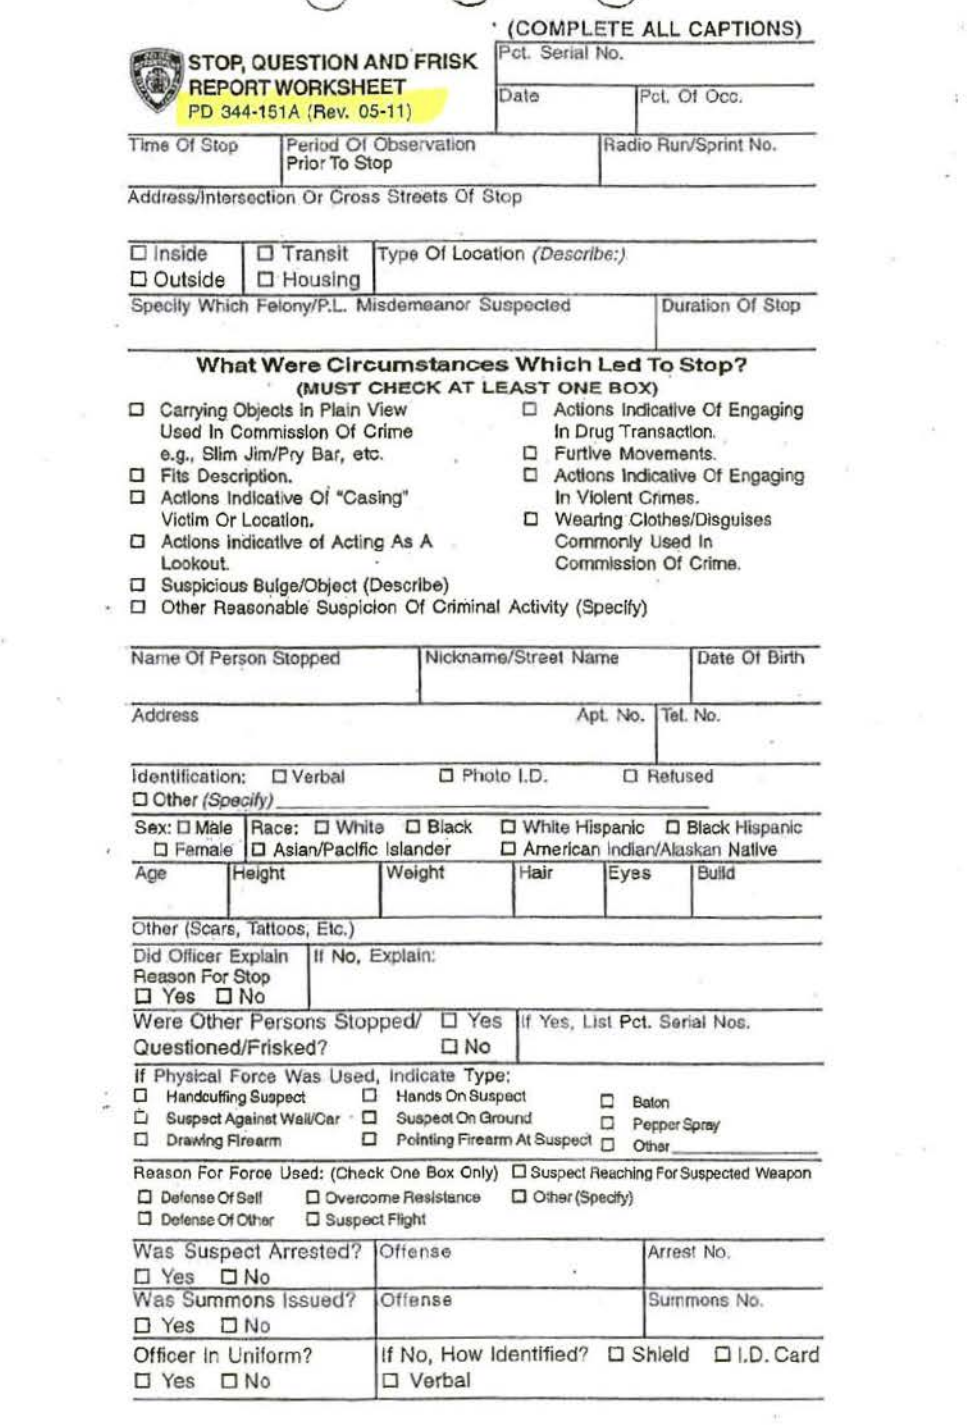
As a result of some high profile police shootings in the late 1990s and mid-2000s, both the New York State Attorney General’s Office and the New York Civil Liberties Union began to examine NYPD stop and frisk activity for racial profiling. With pressure from these organizations, in the mid-2000s, information recorded on UF-250 forms began getting reported in public databases.
Since then, the NYCLU has been using the data to conduct annual reports investigating the degree of racial profiling in stop and frisk activity in NYC. Through this research, they have been able to show that stops increased almost 700% from 2002 to 2011 - the year that marked the height of stop and frisk activity in NYC.
When the NYPD’s use of stop and frisk went before the US District Court in the early 2010s, these public databases were integral in proving that stop and frisk was being carried out in NYC in an unconstitutional way. The ruling mandated that the NYPD create a policy outlining when stops were authorized, and since the practice has declined. See (Smith 2018) and (Southall and Gold 2019) for more information.
Setting Up Your Environment
- Run the code below to load today’s data frames into your environment.
- We will analyze data for all stops in 2011. This data can be found here. However, we’re only going to be considering a subset of the columns. Review the data dictionary for the columns we’re using in this analysis.
| VARIABLE | DEFINITION | POSSIBLE VALUES |
|---|---|---|
| pct | Precinct of the stop | 1:123 |
| arrestsum | Was an arrest made or summons issued? | 1 = Yes 0 = No |
| frisked | Was suspect frisked? | 1 = Yes 0 = No |
| wpnfound | Was a weapon found on suspect? | 1 = Yes 0 = No |
| race_cat | Suspect’s race | AMERICAN INDIAN/ALASKAN NATIVE ASIAN/PACIFIC ISLANDER BLACK BLACK-HISPANIC OTHER WHITE WHITE-HISPANIC |
| age | Suspect’s age | 999 indicates a missing value |
- The original dataset codes each race with a single letter. Run the code below to add a column called
race_catthat writes out each racial category in accordance with the data documentation. It also replaces every instance of “Y” in the dataset with 1 and every instance of “N” with 0. This will allow us to sum the Yes’s in the dataset. You’ll learn more about how this code works in coming weeks.
sqf_2011 <-
  sqf_2011 |>
  select(pct, race, age, frisked, pistol, riflshot, asltweap, knifcuti, machgun, othrweap, sumissue, arstmade) |>
  left_join(sqf_2011_race_cat, by = "race") |>
  mutate(across(frisked:arstmade,
         ~ case_when(. == "Y" ~ 1, . == "N" ~ 0)))
rm(sqf_2011_race_cat)- Navigate to the NYCLU’s webpage documenting statistics from analysis of annual stop and frisk data. Scroll to the data for 2011. In today’s lab, we are going to replicate their analysis in an attempt to produce/verify these numbers.
Analysis
Terry v. Ohio ruled that officers with “reasonable suspicion” that a stopped individual was carrying a weapon may frisk that individual for weapons.
In order to assess how “reasonable suspicion” was being applied in NYC in 2011, we are eventually going to analyze how many 2011 stops resulted in a frisk, how many frisks resulted in a weapon found on an individual, and how many stops resulted in either an arrest or summons.
The original dataset had separate variables for indicating whether a pistol, rifle, assault weapon, knife, machine gun, or other weapon was found on a suspect. We will create a variable equal to 1 if any of these weapons were found on the suspect. Further, the original dataset had separate variables for indicating whether a stop resulted in an arrest made or summons issued. We will create a variable equal to 1 if either occurred.
Question
Add two new columns. The first should indicate whether a weapon was found, and the second should indicate whether an arrest/summons was made.
sqf_2011 <-
  sqf_2011 |>
  #Add a variable for weapon found
  _____(wpnfound = case_when(pistol == 1 |
                               riflshot == 1 |
                               asltweap == 1 |
                               knifcuti == 1 |
                               machgun == 1 |
                               othrweap == 1 ~ 1,
                             TRUE ~ 0))
sqf_2011 <-
  sqf_2011 |>
  #Add a variable for arrest made or summons issued
  _____(arrestsumm = case_when(sumissue == 1 |
                                arstmade == 1 ~ 1,
                               TRUE ~ 0))
Tip
case_when() allows us to assign values based on whether certain criteria is met. Here is the basic formula:
case_when(
  <criteria to check> ~ <set to this value if criteria is met>,
  TRUE ~ <set to this value if criteria is not met>
  )
Check out the code above. In the first line of code, we set the value for wpnfound to 1 if the first criteria is met (i.e. if pistol equals 1 or riflshot equals 1, and so on.) Otherwise, we set the value for wpnfound to 0.
Now that you’ve run this code, open up the data frame in the View window. What is the unit of observation in this dataset? What variables describe each row?
We don’t need all of these columns in this data frame for this analysis. In fact, to replicate the NYCLU’s 2011 analysis, we only need six columns from this data frame.
Question
Subset the dataset to the six variables listed in the data dictionary above.
sqf_2011 <-
  sqf_2011 |>
  _____(pct, arrestsumm, _____, wpnfound, race_cat, _____)
In order to be able to determine the percentage of stops that resulted in a frisk, weapon found, or arrest/summons, we are going to need to know how many total stops were conducted in NYC in 2011. We are going to store that value in the variable total_stops so that we can refer to it later.
Question
Calculate the number of stops in 2011. If you are not sure which function to use below, you may want to refer to the list of Summary functions in the the Data Wrangling cheatsheet. Remember that each row in the data frame is a stop.
total_stops <-
  sqf_2011 |>
  summarize(Count = _____) |>
  pull()

total_stops
Tip
summarize() will return a data frame with the summarized value. Remember a data frame is a two-dimensional table with rows and columns (even if it’s a 1x1 table). If we want just the value, we can call pull() to extract the value from that two–dimensional table.
Recall that for stops to be legally justified, officers must have “reasonable suspicion” that an individual committed a crime. This means that officers must be able to offer “specific and articulable facts,” along with rational inferences based on those facts, that an individual had committed a crime, in order to justify a stop. Reasonable suspicion requires more than a ‘hunch’.
For this reason, one of first metrics that the NYCLU calculates in their reports is the number and percentage of stops in which in the stopped individuals turned out to be innocent.
Question
How many stops did not result in an arrest or summons in 2011? What percentage of stops did not result in an arrest or summons?
sqf_2011 |>
  #Subset to rows where suspect innocent
  _____(arrestsumm _____ 0) |>
  #Calculate number of observations
  _____(total_innocent = n(),
            percent_innocent = _____ / total_stops * 100)
In order to assess how stop and frisk may be carried out in a discriminatory way, the NYCLU’s reports go on to look at stops through the lens of a number of demographic indicators, including the age, race, gender, and ethnicity of the individuals stopped. For starters, let’s look at how many young people (14-24) were stopped in NYC in 2011.
Question
In how many stops were the individuals aged 14-24? In what percentage of stops were the individuals aged 14-24?
sqf_2011 |>
  #Subset to rows where suspect age 14-24
  _____(age _____ 14 & age _____ 24) |>
  #Calculate number of observations and percentage of observations
  _____(total_14_24 = _____,
            percent_14_24 = n() / total_stops * 100)
Why doesn’t this match the values we see on the NYCLU website?
Note the following from the NYCLU’s 2011 report on Stop, Question, and Frisk data:
“In a negligible number of cases, race and age information is not recorded in the database. Throughout this report, percentages of race and age are percentages of those cases where race and age are recorded, not of all stops.”
Note that it is very common in government datasets for missing values to get coded as 999 or -999. Here we want to exclude those values in the age column.
Question
Fix the code below to calculate the currect number of stops for individuals 14-24.
total_stops_age_recorded <-
  sqf_2011 |>
  #Subset to rows where age is not 999
  _____(age _____ 999) |>
  summarize(Count = n()) |>
  pull()

sqf_2011 |>
  filter(age >= 14 & age <= 24) |>
  summarize(total_14_24 = n(),
            percent_14_24 = n() / total_stops_age_recorded * 100)
This still doesn’t match the values we see on the website, but it does match the values we see in the NYCLU’s 2011 report on Stop, Question, and Frisk data. This is typically when I would reach out to a representative at the NYCLU to inquire about the discrepancy.
Question
How many stops were there per race in 2011? What percentage of stops per race in 2011? Arrange by number of stops in descending order.
total_stops_race_recorded <-
  sqf_2011 |>
  #Subset to rows where race_cat is not NA or "OTHER"
  filter(_____(race_cat) & race_cat _____ "OTHER") |>
  summarize(Count = n()) |>
  pull()

sqf_2011 |>
  #Subset to rows where race_cat is not NA or "OTHER"
  _____(_____(race_cat) & race_cat _____ "OTHER") |>
  #Group by race
  _____(race_cat) |>
  #Calculate number of observations
  _____(stops = n(),
            percent_stops = n() / total_stops_race_recorded * 100) |>
  #Sort by stops in descending order
  _____(_____(stops))
Note how this dataset categorizes race. Many different government datasets categorize race in many different ways. How we categorize race matters for how we can talk about discrimination and racial profiling. Imagine if WHITE was not categorized separately from WHITE-HISPANIC. The values in this dataset would appear very differently!
When compiling their report, the NYCLU chose to aggregate two racial categories in this dataset into the one category - Latinx - in order to advance certain claims regarding discrimination. What we should remember is that these racial categories are not reported by those stopped; they are recorded by officers stopping individuals. They may not reflect how individuals identify themselves.
Question
In how many stops were the individuals identified as Latinx (i.e. “WHITE-HISPANIC” or “BLACK-HISPANIC”)? In what percentage of stops were the individuals identified as Latinx?
sqf_2011 |>
  #Subset to rows where race_cat is "WHITE-HISPANIC" or "BLACK-HISPANIC"
  _____(race_cat _____ c("WHITE-HISPANIC", "BLACK-HISPANIC")) |>
  #Calculate number of observations
  _____(stops_Latinx = _____,
            percent_Latinx = n() / total_stops_race_recorded * 100)
As a final consideration, we are going to calculate some summary statistics to further our understanding of the discriminatory ways in which this practice was being carried out. To so so, we are going to look at a racial breakdown of which stops resulted in an arrest/summons, and which frisks resulted in a weapon found.
Question
What percentage of stops in 2011 resulted in a frisk per race? What percentage of stops in 2011 resulted in a weapon found per race? What percentage of stops in 2011 resulted in an arrest or summons per race? In your resulting data table, each row should be a race, and there should be columns for stops, percent_stops, percent_frisked, percent_wpnfound , and percent_arrestsumm.
# Write code here. Question
Below, in 2-3 sentences, summarize what you learn from reviewing the summary statistics from the code above. What does this tell us about the constitutionality of 2011 stop and frisk activity in NYC?
Ethical Considerations
In her ruling in the 2011 District Court case Floyd vs. the City of New York, Honorable Shira Sheidlen remarked the following regarding the database of stops we analyzed today:
Because it is impossible to individually analyze each of those stops, plaintiffs’ case was based on the imperfect information contained in the NYPD’s database of forms (“UF-250s”) that officers are required to prepare after each stop. The central flaws in this database all skew toward underestimating the number of unconstitutional stops that occur: the database is incomplete, in that officers do not prepare a UF-250 for every stop they make; it is one-sided, in that the UF250 only records the officer’s version of the story; the UF-250 permits the officer to merely check a series of boxes, rather than requiring the officer to explain the basis for her suspicion; and many of the boxes on the form are inherently subjective and vague (such as “furtive movements”). Nonetheless, the analysis of the UF-250 database reveals that at least 200,000 stops were made without reasonable suspicion.
What are some of the consequences of the incompleteness and/or one-sided nature of this dataset? How should we think about and communicate its flaws vs its value? How might this data collection program be redesigned so as to represent more diverse perspectives? Share your ideas on our sds-192-discussions Slack channel.
#If you finish early, I encourage you to attempt to plot some of this data below using `ggplot()`!References
Smith, Chris. 2018. “The Crime-Fighting Program That Changed New York Forever.” http://nymag.com/intelligencer/2018/03/the-crime-fighting-program-that-changed-new-york-forever.html.
Southall, Ashley, and Michael Gold. 2019. “Why ‘Stop-and-Frisk’ Inflamed Black and Hispanic Neighborhoods (Published 2019).” The New York Times, November. https://www.nytimes.com/2019/11/17/nyregion/bloomberg-stop-and-frisk-new-york.html.