Reading layer `nycd' from data source
`/Users/lpoirier_1/Documents/GitHub/sds-192-public-website-quarto/website/data/nyc_community_districts/nycd.shp'
using driver `ESRI Shapefile'
Simple feature collection with 71 features and 3 fields
Geometry type: MULTIPOLYGON
Dimension: XY
Bounding box: xmin: 913175.1 ymin: 120128.4 xmax: 1067383 ymax: 272844.3
Projected CRS: NAD83 / New York Long Island (ftUS)Polygon Mapping
SDS 192: Introduction to Data Science
Lindsay Poirier
Statistical & Data Sciences, Smith College
Fall 2022

Administrative Boundaries: US Census
Administrative Boundaries: US Census
Administrative Boundaries: US Census
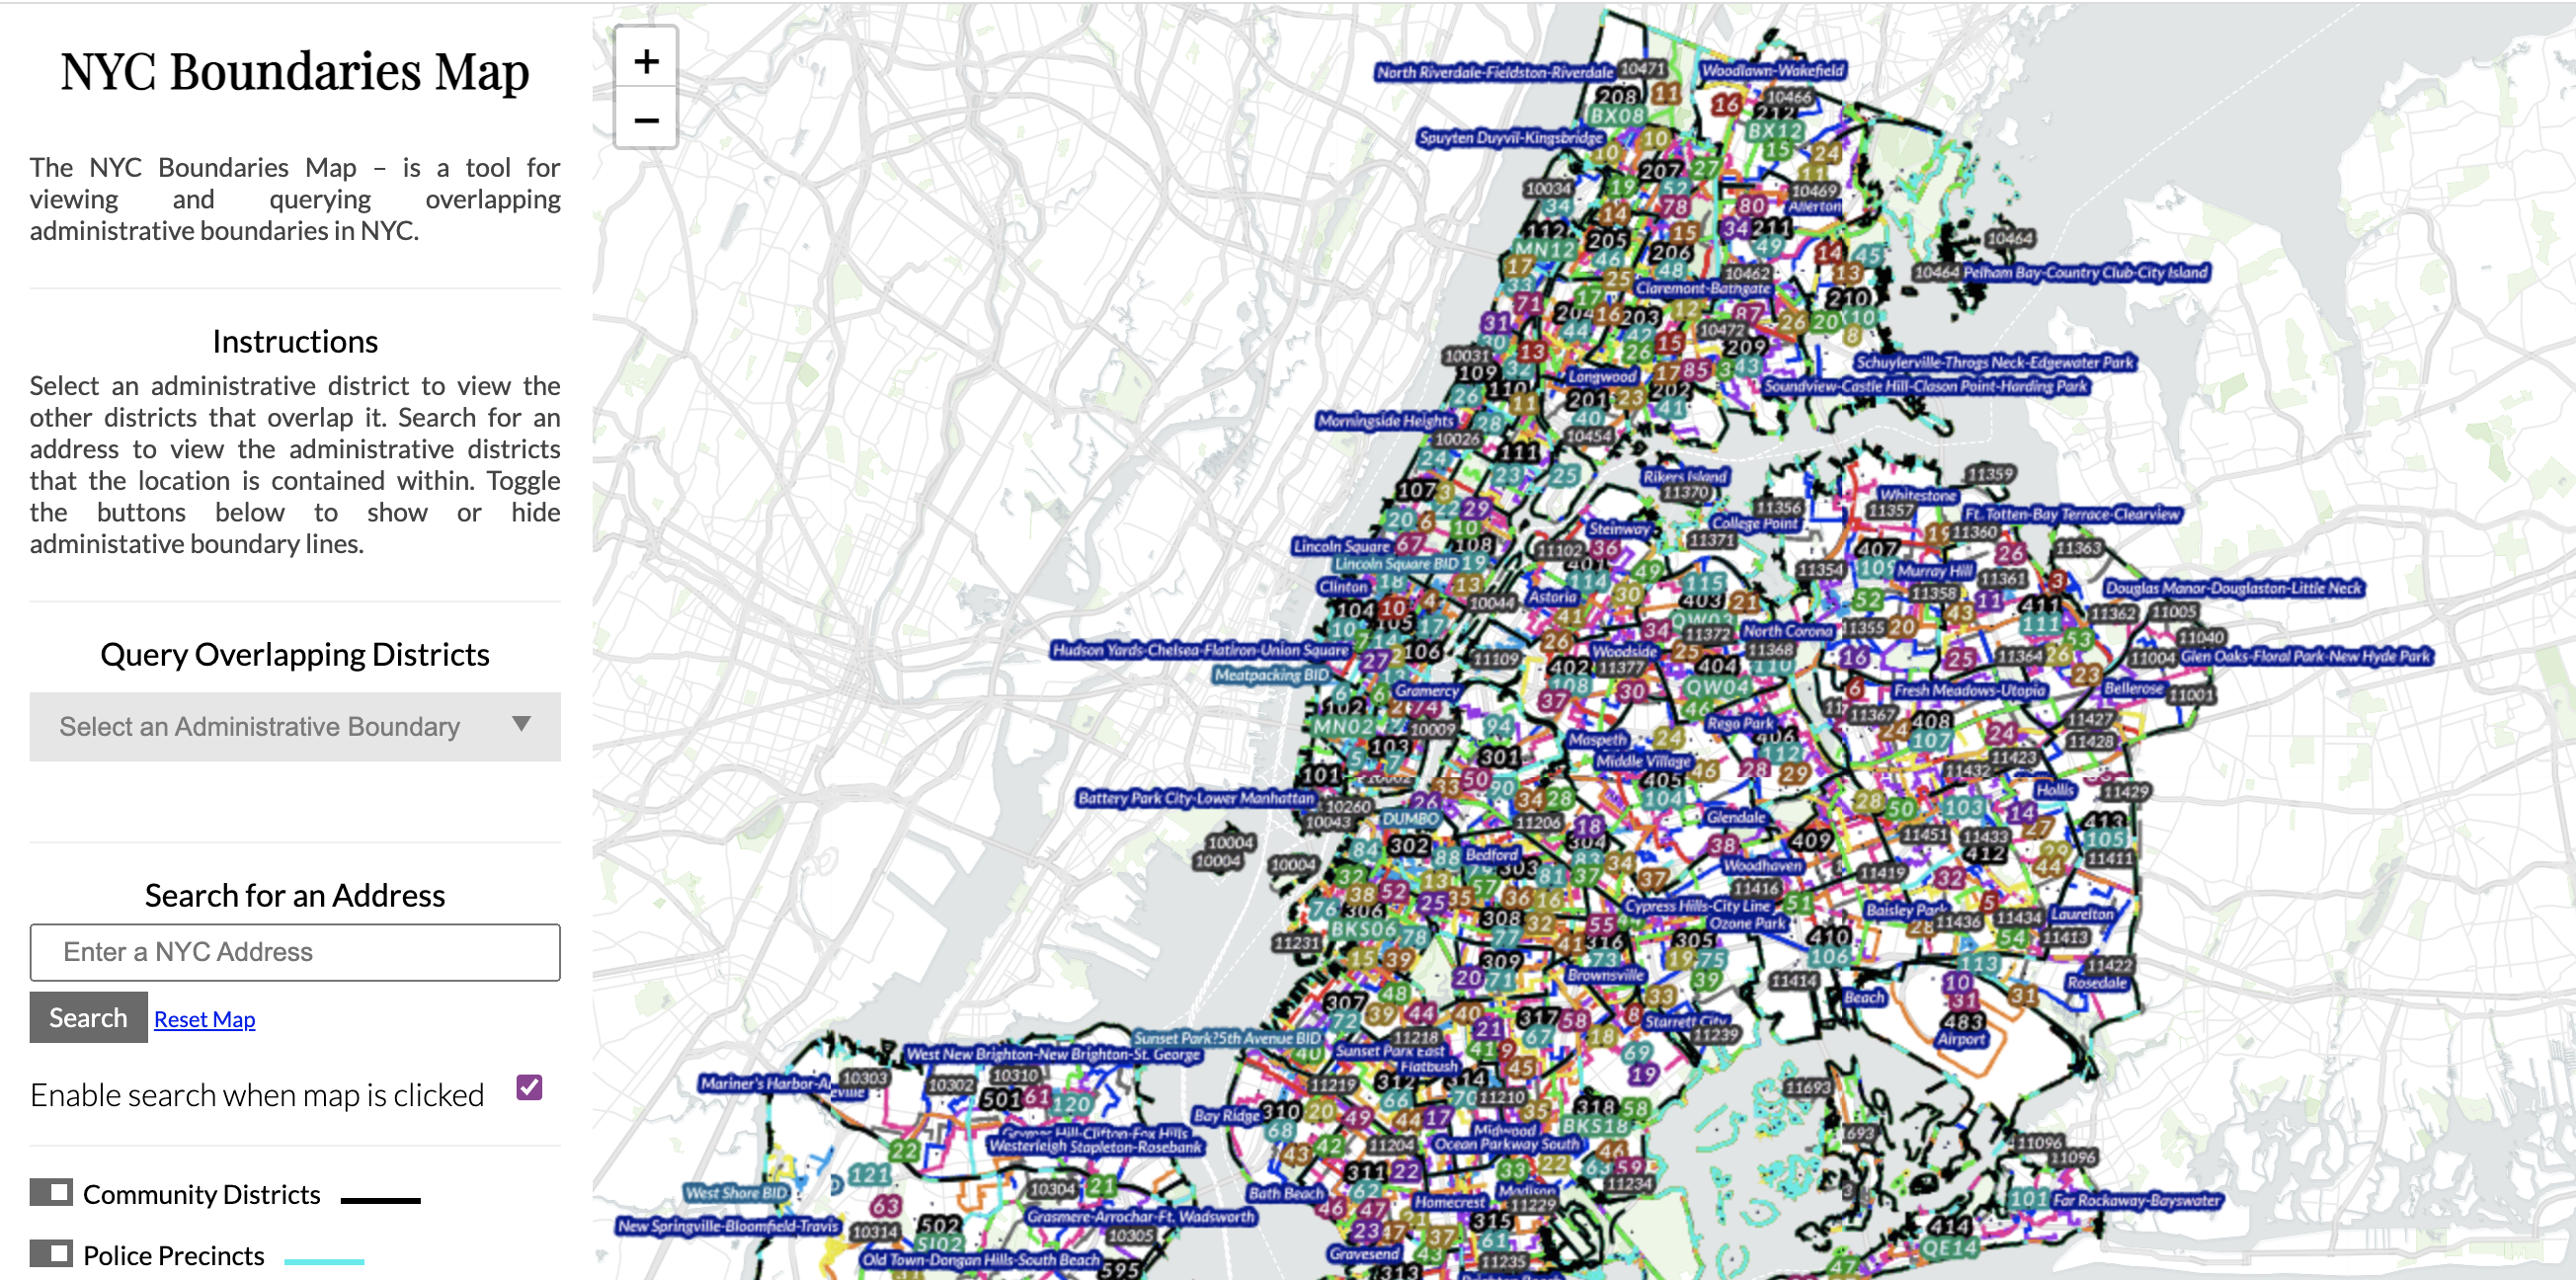
Administrative Boundary Soup
Feature Boundaries
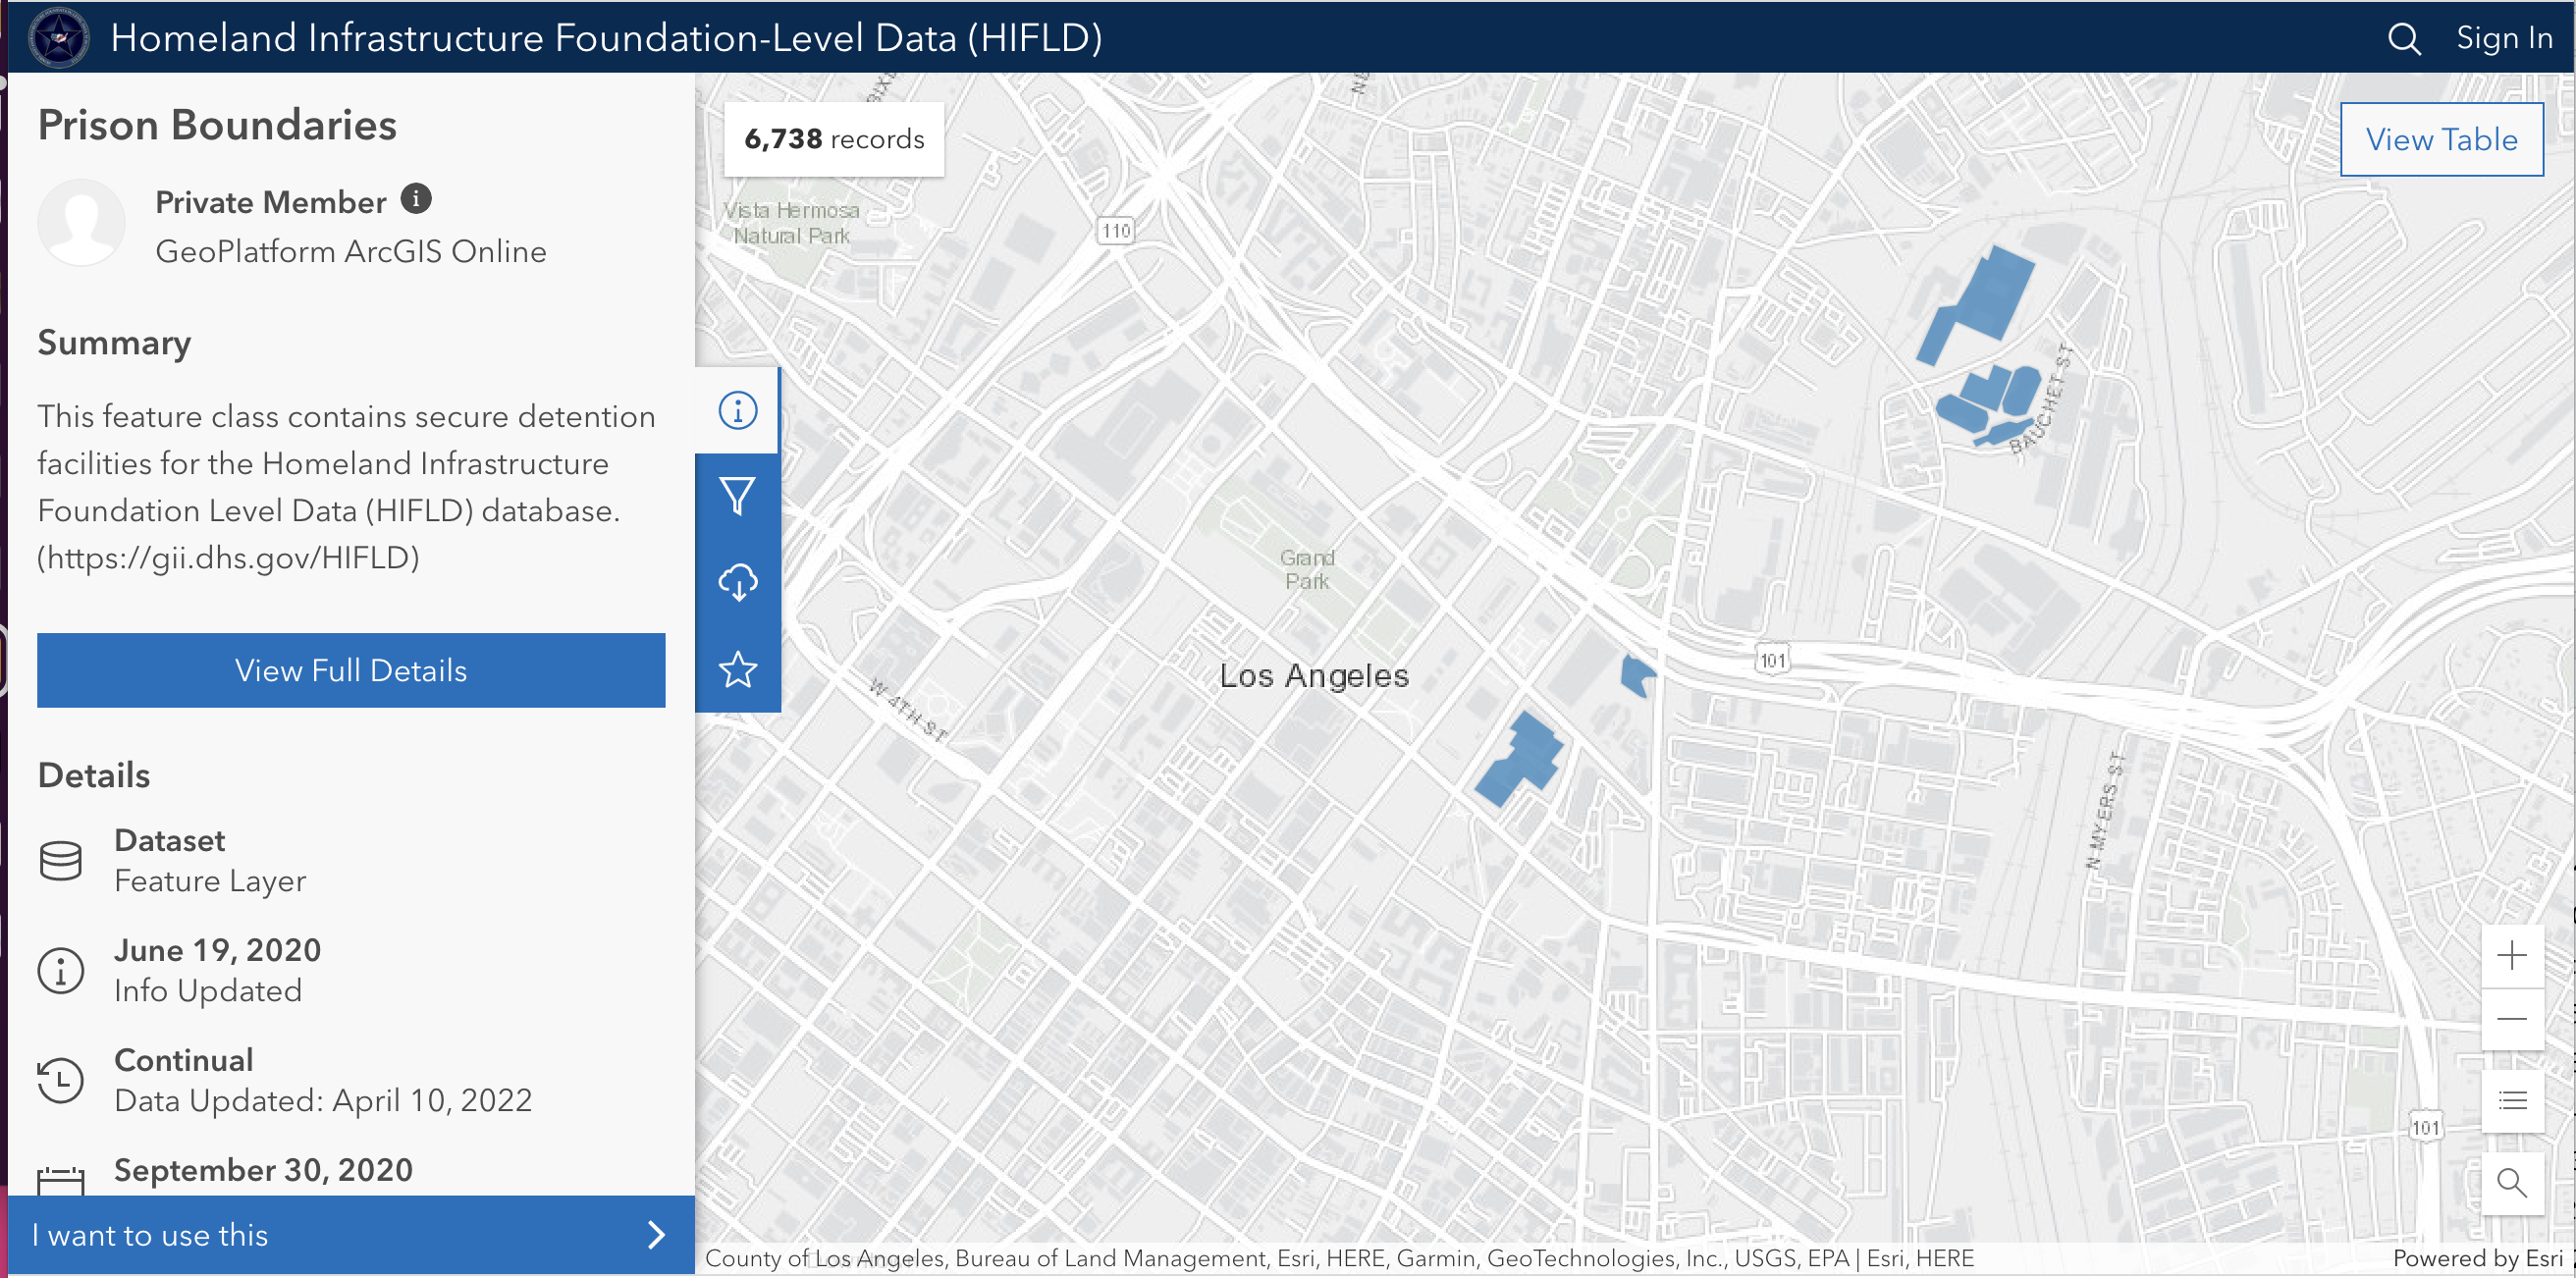
Feature Boundaries
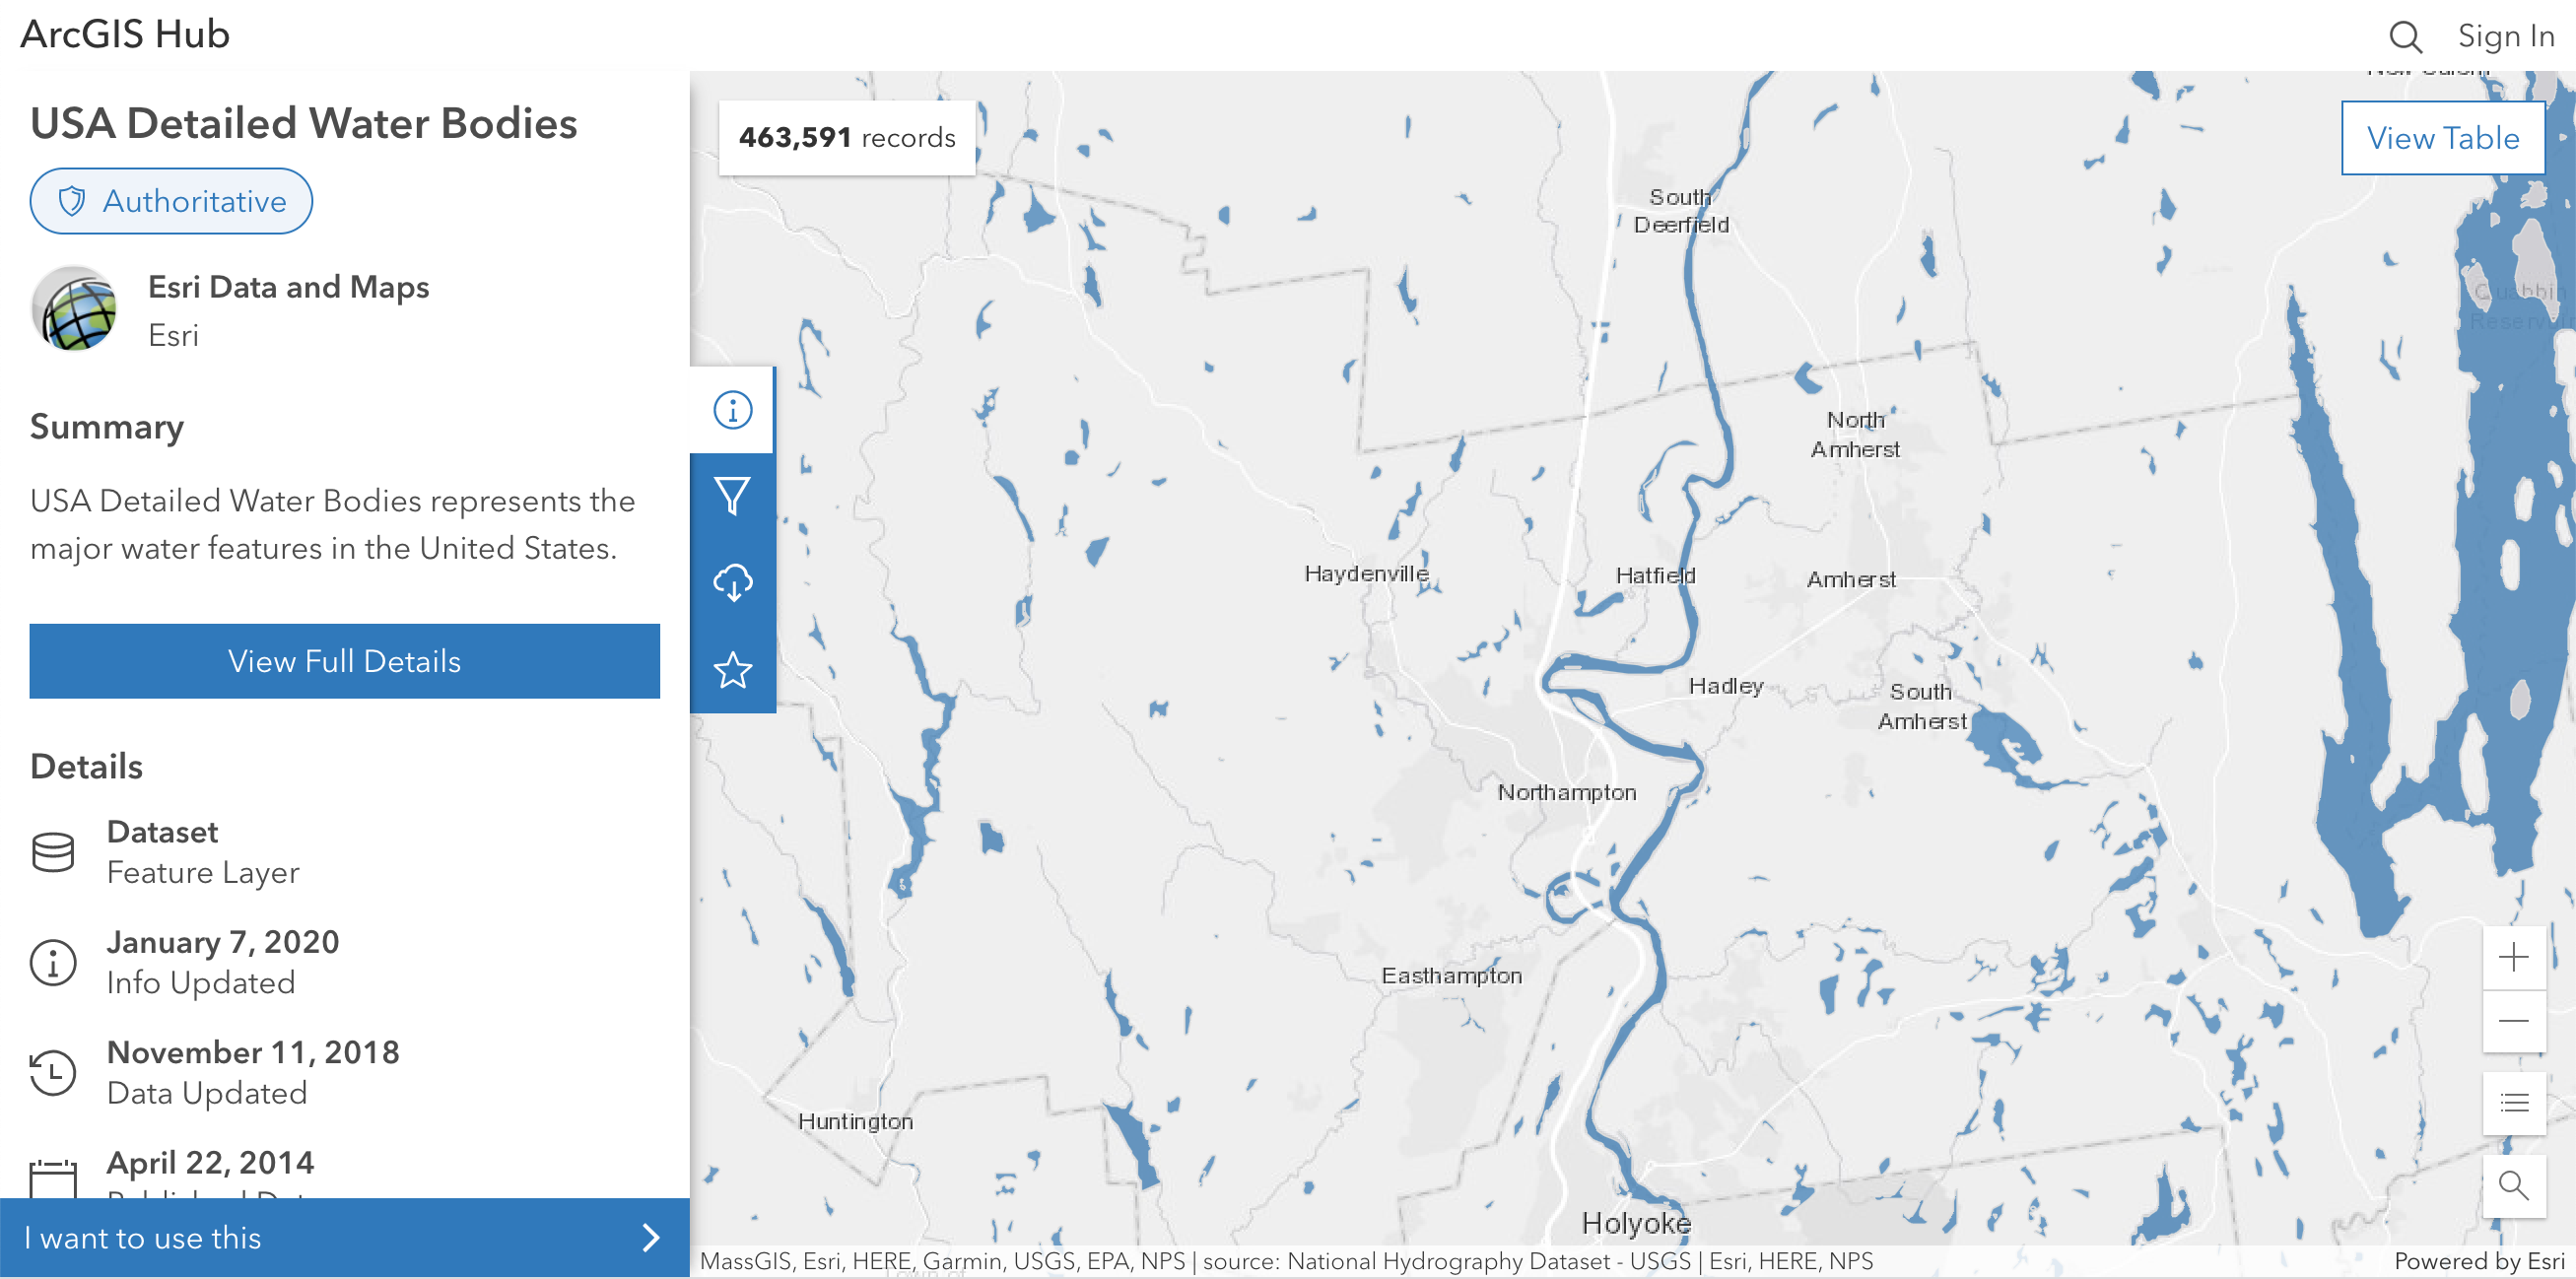
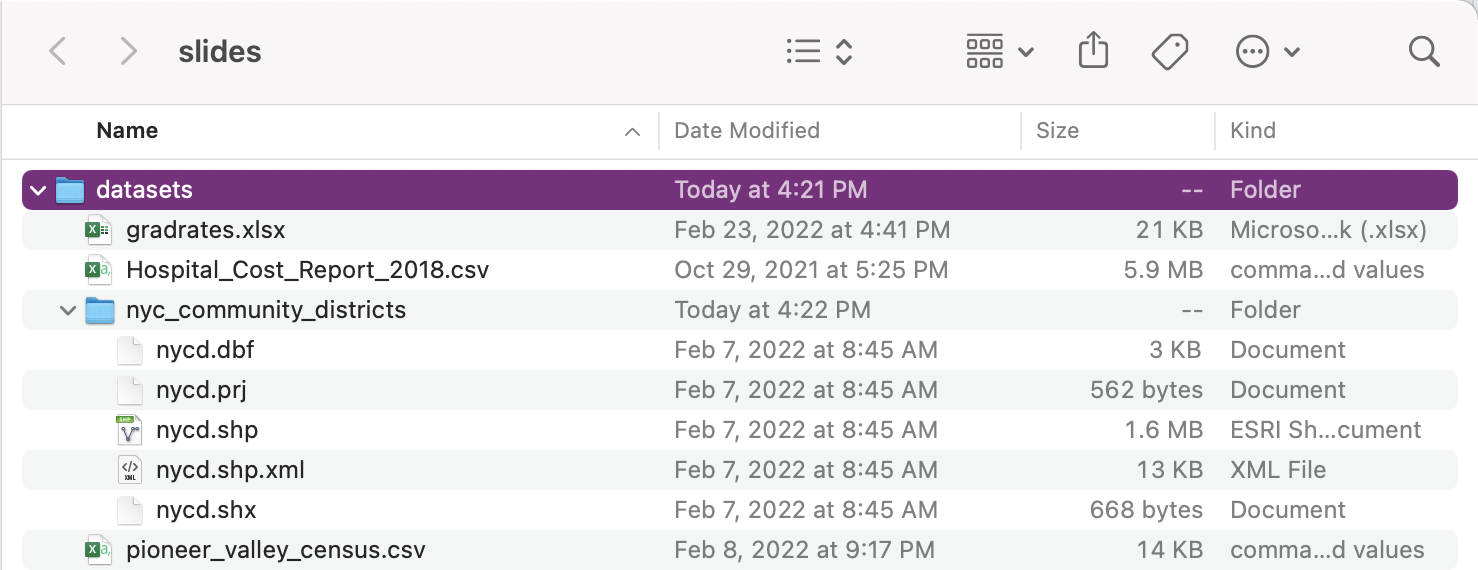
Importing Shapefiles
- Function
st_read()fromsfpackage used to read in shapefiles