How to Lie with Maps

SDS 192: Introduction to Data Science

Lindsay Poirier
Statistical & Data Sciences, Smith College

Fall 2022

For Today

  • Quiz 2 Posted!
  • Project 3 Template Posted!
  • Strategies for Lying with Maps

All maps lie!

Acknowledgements

Today’s lecture is almost entirely structured based on:

Deluca, Eric, and Sara Nelson. 2017. “7. Lying With Maps.” In Mapping, Society, and Technology, edited by Steven Manson. Minneapolis, Minnesota: University of Minnesota Libraries Publishing. https://open.lib.umn.edu/mapping/chapter/7-lying-with-maps/.

Projections

Symbolization

Symbolization

Cartograms

Benjamin Hennig, https://www.viewsoftheworld.net/
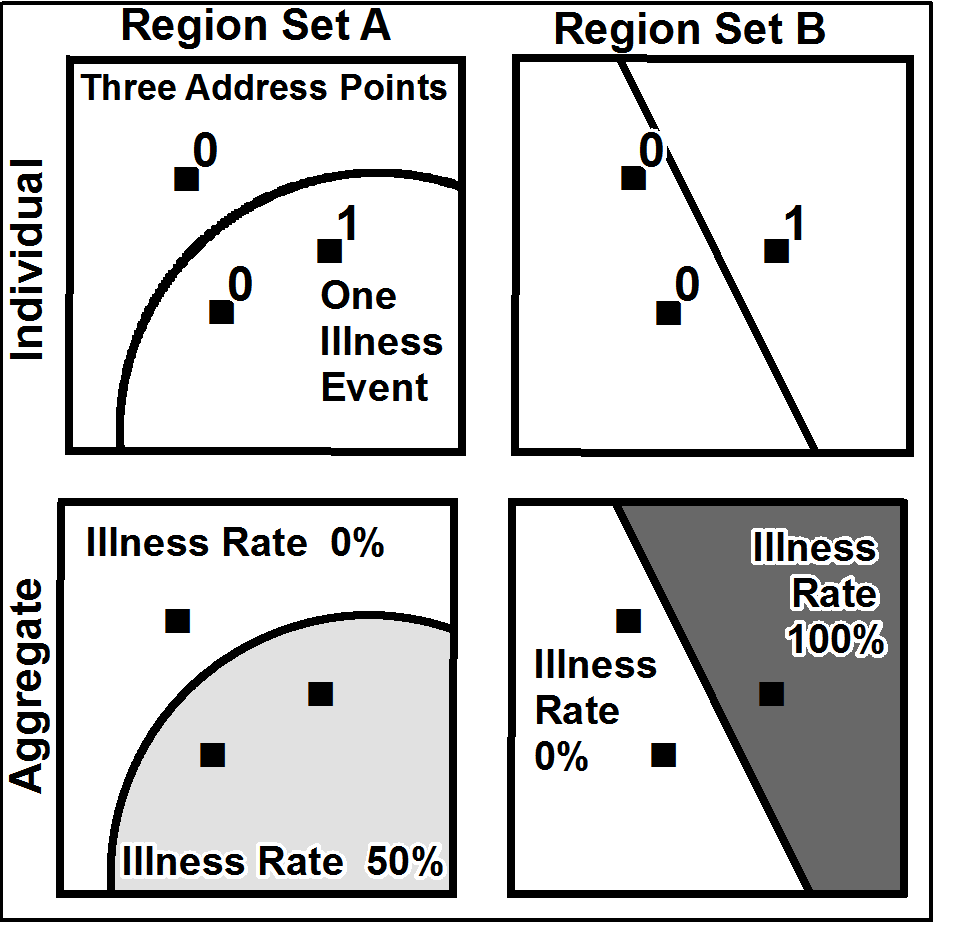
Standardization

Classification

Classification

Binning creates equal interval breaks, and classifies the data into the intervals.

Quantiles creates breaks so that there are the same number of observations classified into each bin.

Aggregation

  • Ecological fallacy: Assuming that a value calculated for a group is equivalent to the values for individual members of the group

Zonation

  • Modifiable Aerial Unit Problem
  • The boundaries we aggregate data into are often arbitrary (i.e. not meaningful for the analysis)
    • If I’m studying air quality effects of a facility on surrounding populations, air pollution doesn’t stop at a zip code even if I aggregate my data by zip code.
  • Drawing boundaries in a different way would produce different results.

Gerrymandering

Prison-based Gerrymandering